Cart on a Ramp Lab
- akalyan-23
- Oct 2, 2021
- 4 min read
Lab Partners: Leyton Shroff, Adithya Kalyan, Tyler Frojmovich
Date: 9/24/2021
How does time affect the position of the cart on the ramp?
Independent Variable: Time (seconds)
Dependent Variable: Position (meters)
Controls: Same ramp, the force used at dropping the cart onto the ramp, starting time, ending time, initial position, final position, the scale of measurement, air resistance, friction, surroundings/environment, person releasing the cart.
Controlling Variables: For the timing of the cart on the ramp the three of us used the same video of the experiment taking place and set the initial time of all three logger pro modified videos to the same frame.
Developed Method for Collection of Data
Leyton will start by taking a video, and after signaling Tyler, Tyler will release the cart down the ramp. As soon as the cart reaches the bottom of the ramp, Adithya will stop it and Leyton will stop the video. We will have a meter stick for a reference scale in the video as well. Then we will input this video into logger pro where we will adjust the beginning of the video to be the first frame at which the ball is dropped and set the origin to the top of the ramp and tilt the frame to align itself with the angle of the ramp.
Procedure
We measured the position of the cart moving down the ramp in response to the increasing time.
We only ran one trial.

Recorded Raw Data
*Cart constant*
*Environment constant*
Initial Position - 0 meters

Processed Raw Data
We processed the quantitative data correctly because we had one trial so there was no room for inconsistency through the experiment. We also used professional software to analyze the movie we made, therefore getting extremely accurate X position values. We, therefore, know for a fact that our initial position was constant and that the displacement is not wrong. One fault with our collection of data is our dependence on the software. It is very possible that the software could be wrong but we believed it.
Presentation of Processed Data

Position-Time Graph

Line of Best Fit: -0.4669t^2 - 0.02667t+ 0.00435
Slope Interpretation: The acceleration of our cart was 0.4669 m/s/s
Velocity- Time Graph
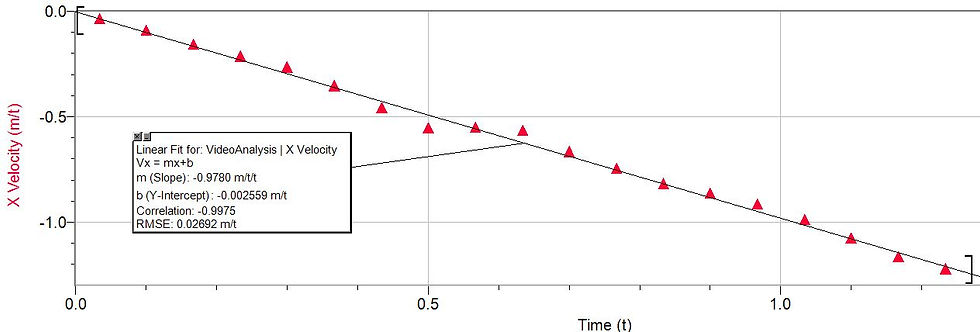
Line of Best Fit: -0.9780m/t/t-0.002559
slope interpretation: the cart's velocity is increasing by a factor of 0.978 m/s each second.
y-intercept interpretation: the velocity of the cart at the initial position is 0.002559 m/t
Final Results
The evidence shows that the velocity of the cart exponentially increases as time goes on. We know that the velocity is increasing because the line best fit for the position-time graph was a quadratic. We also know this because the line of best fit for the Velocity-Time graph was a linear line with a slope of -0.978 meaning that there was a change in the velocity. If the velocity-time graph showed a horizontal line we would know that the velocity was constant through the experiment. We can generalize this information for use in other situations in the cases that if a cart is rolled down from the top of a ramp, the velocity of the cart will increase with time and form a quadratic for the position-time graph.
Conclusion
We know that time affects the position of any object on a flat surface by a relationship of positive linear association as demonstrated by the Buggy Lab. From the Cart On a Ramp lab, we can conclude that any object that is rolled down a ramp will have an increasing velocity as time goes on until it is stopped. We can conclude that we have an accurate experiment despite only doing one trial. Due to the fact that we only did one trial, there was no room for great variability that would change the entire experiment. In addition to this, since we used computer software to calculate the velocity of the graph at various points instead of using our own calculations the tables and graphs are very accurate. From this experiment, I learned how to calculate the final position of an object given its velocity, change in time, and initial position. I also learned that the sign of the slope only indicates the direction in which the object is moving and not the magnitude. Another learning point for me was that the A value in a quadratic equation represents the acceleration of an object. The equation used to calculate the final velocity of an object can be found using the acceleration, change in time, and the initial velocity, and to find the acceleration you have to divide the final velocity minus initial velocity by the change in time. This lab opened up a lot of formulas and a lot of parts of physics for me.
Evaluating Procedures
The velocity of the cart at its initial position was 0.002559 meters/second which is a fault in our experiment because it means that when the experiment started at its initial position it already had picked up some speed from whatever little force was put behind it at the beginning. However, the velocity was so small that in the grand scheme of things it doesn't affect our experiment. Another possible weakness in our experiment is the lack of trials since we only did one. However, I believe that even if we did 5 trials, the results would be nearly identical since there isn't any variable that would greatly change through each trials. We also made the assumption that the information that the movie analyzing software on our computers was making accurate calculations. If it was not then our entire experiment would be inaccurate.
Improving the Investigation
One basis for improvement is the length of the experiment. Since we only had a 1-meter long ramp we had this ramp based near the edge of the table and one person had to stop the cart as soon as it reached the end of the ramp which caused the cart to bounce back and as a direct result the software picked up the cart bouncing back and then we had to crop that part out of the table and graph. Another benefit of having a longer ramp would be that the experiment would be longer and therefore we would have more data points. Another thing that we could improve upon is the number of trials we ran. We could run at least one or two more trials to make sure that this one trial was not an abnormality. Also at the beginning of our experiment, our cart's velocity was 0.002559 m/s which logically should not be possible unless we put some force behind it at the start so to improve we could make sure that the initial velocity was zero.

Comments